unwrap the unseen
by Neil Caudle
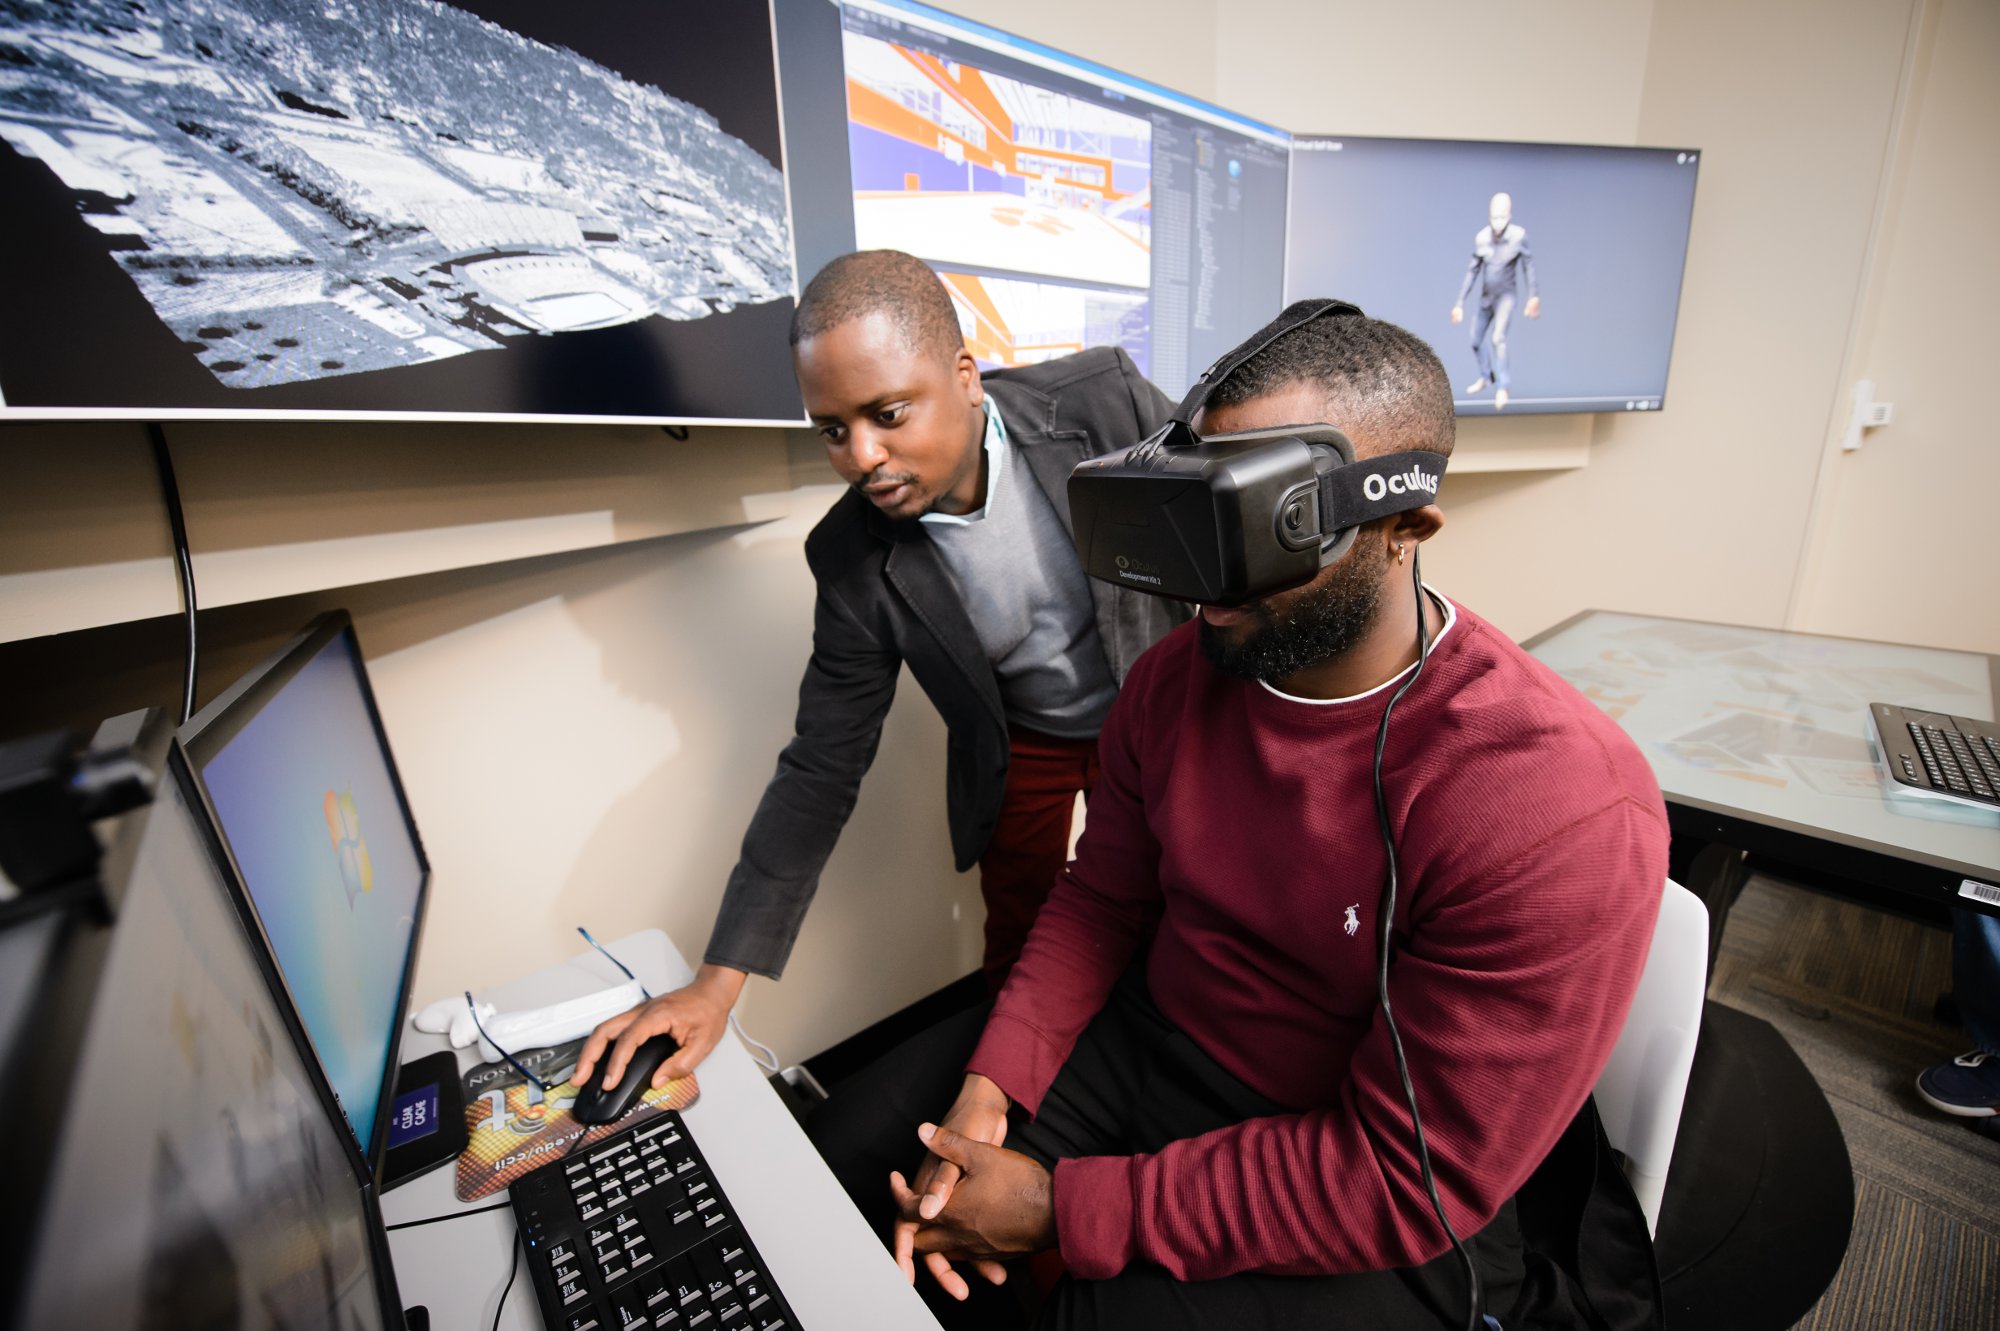
Photo of Oyekoya and students by Craig Mahaffey.
Fellow parents, it’s time to thank the gamers.
All of that time and money our kids have lavished on video games did not go to waste. The investment has helped reinvent modern science.
For several decades, our culture’s insatiable appetite for bigger, faster, more lifelike games has inspired high-tech industry to crank out ever-more-powerful chips to fill our screens with action-packed animations. Today, those chips, known in the trade as graphic processing units or GPUs, can blaze through the likes of Mortal Kombat or Call of Duty at warp speed, without dropping a pixel.
And now, those same GPUs have begun to reveal, in astounding detail, whole new realms of science.
And it’s not just the hardware retooling research. Those kids we nagged to unplug their controllers and turn off their screens? Lots of them are now plying their well-honed visual acuity in labs around the world. They are mining huge mountains of data and bringing them to life.
It’s one thing to hit the leaderboard for “Grand Theft Auto;” it’s another to unearth a secret of nature. Yes, our gamer kids can do that now. And science will never be the same.
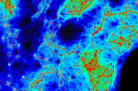
By developing a model of a barnacle larva, Zhang detected, for the first time, the membrane around the chitin plaque. Image courtesy of Andy Mount.
Riding the wave
Andrew Mount, who studies the molecular and cellular biology of marine invertebrate organisms, learned biology the old-fashioned way, with experiments he could observe, using his eyes and a lens, and with drawings rendered by hand.
But when he saw the power of computers to help him detect and display the long-hidden secrets of, say, oyster shell formation or barnacle adhesion, there was no turning back.
Mount and his team now use a powerful confocal microscope to collect three-dimensional data from experiments on biofouling (such as barnacles on ships and marine gear), biomineralization (the way mollusks form their shells), and ocean acidification. The researchers then model their data on computers, in 3-D.
“That allows us to take that three-dimensional data and produce exquisite images, unparalleled in beauty,” Mount says. “And we’ve been doing this since 2010.”
Last summer, through an internship program sponsored at Clemson by the National Science Foundation (NSF), Mount mentored nineteen-year-old Caroline Zhang, a rising sophomore from Emory University. He put her to work turning data into images. One of the problems hassigned her was to help his team visualize the production of chitin, a natural polymer common in crustacean shells and many other living structures, in a barnacle cyprid, the barnacle’s last larval stage before adulthood. Because a cyprid’s job is to find a place to settle and attach, understanding its biology could lead to methods for protecting ships’ hulls and marine gear from fouling. Using software called Imaris, Zhang modeled the data in graphic animations that not only detected a chitin plaque but revealed, for the first time, a membrane surrounding it. The NSF was so impressed that the agency invited Zhang to present her poster, titled “Stuck at Sea,” in Washington, D.C., last October.
“That’s the power of visualization,” Mount says. “You actually can advance science, and you don’t need to have umpteen years at the bench.”
And there’s money in it.
In labs around the world, visualization—seeing what otherwise couldn’t be seen—is taking science to a whole new level. The NSF, recognizing the potential of visualization and its power to attract young people into science, sponsored the summer internship program in which Caroline Zhang took part. Clemson landed the program, called Research Experience for Undergraduates (REU), and brought eight students to campus in June and July of last year. Vetria L. Byrd, who was then a visualization scientist with Clemson’s computing division, CCIT, wrote the grant and directed the program.
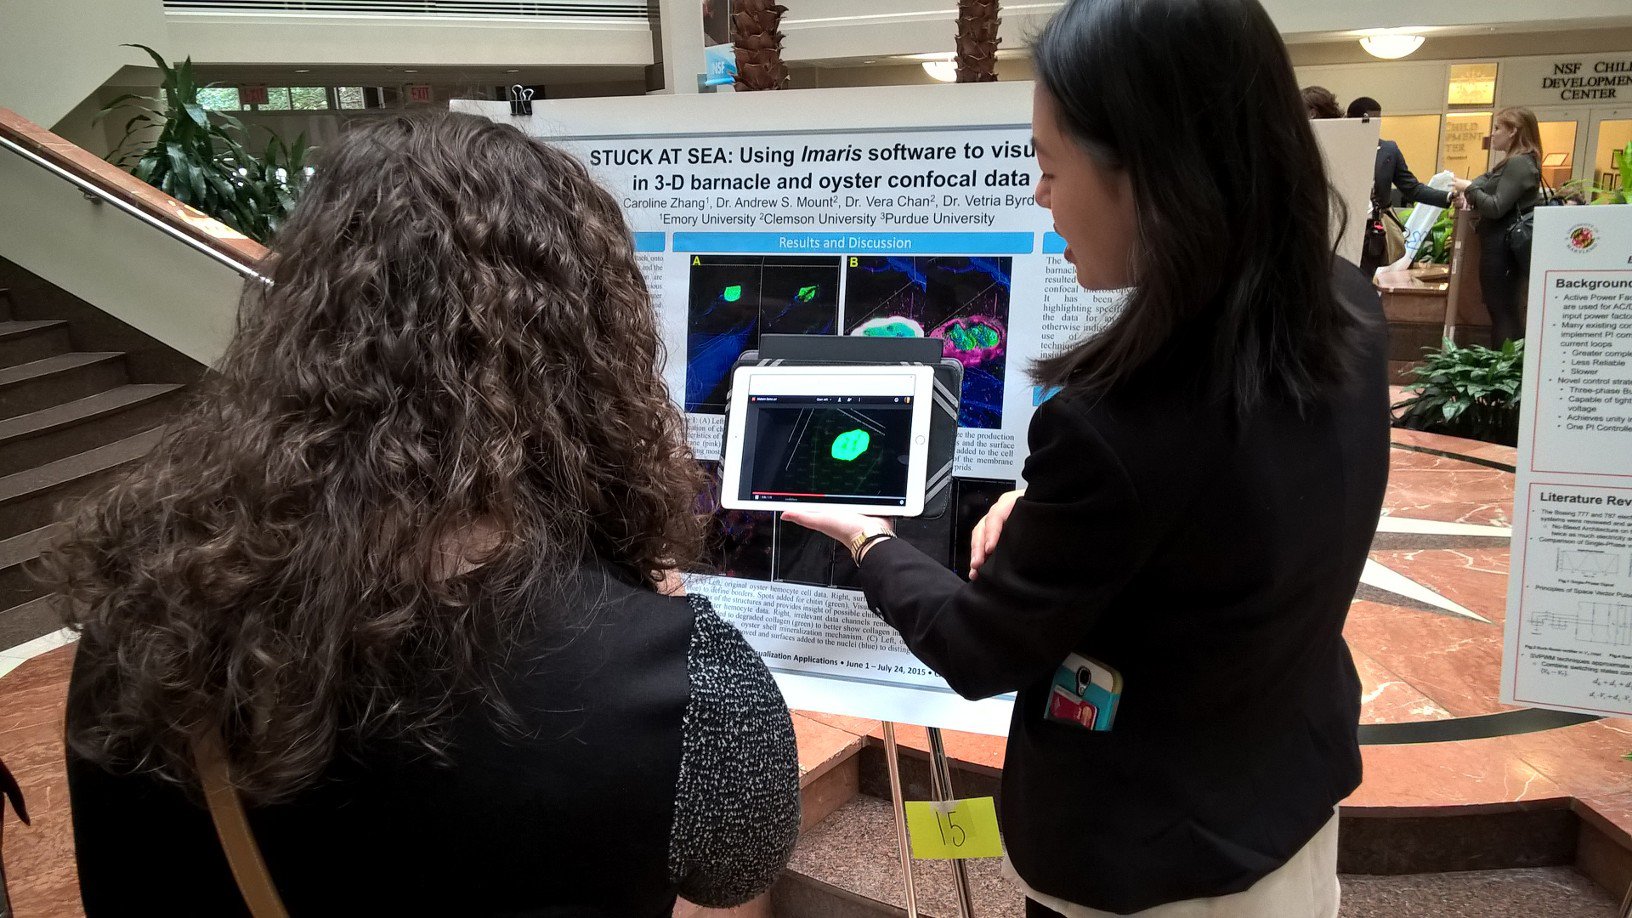
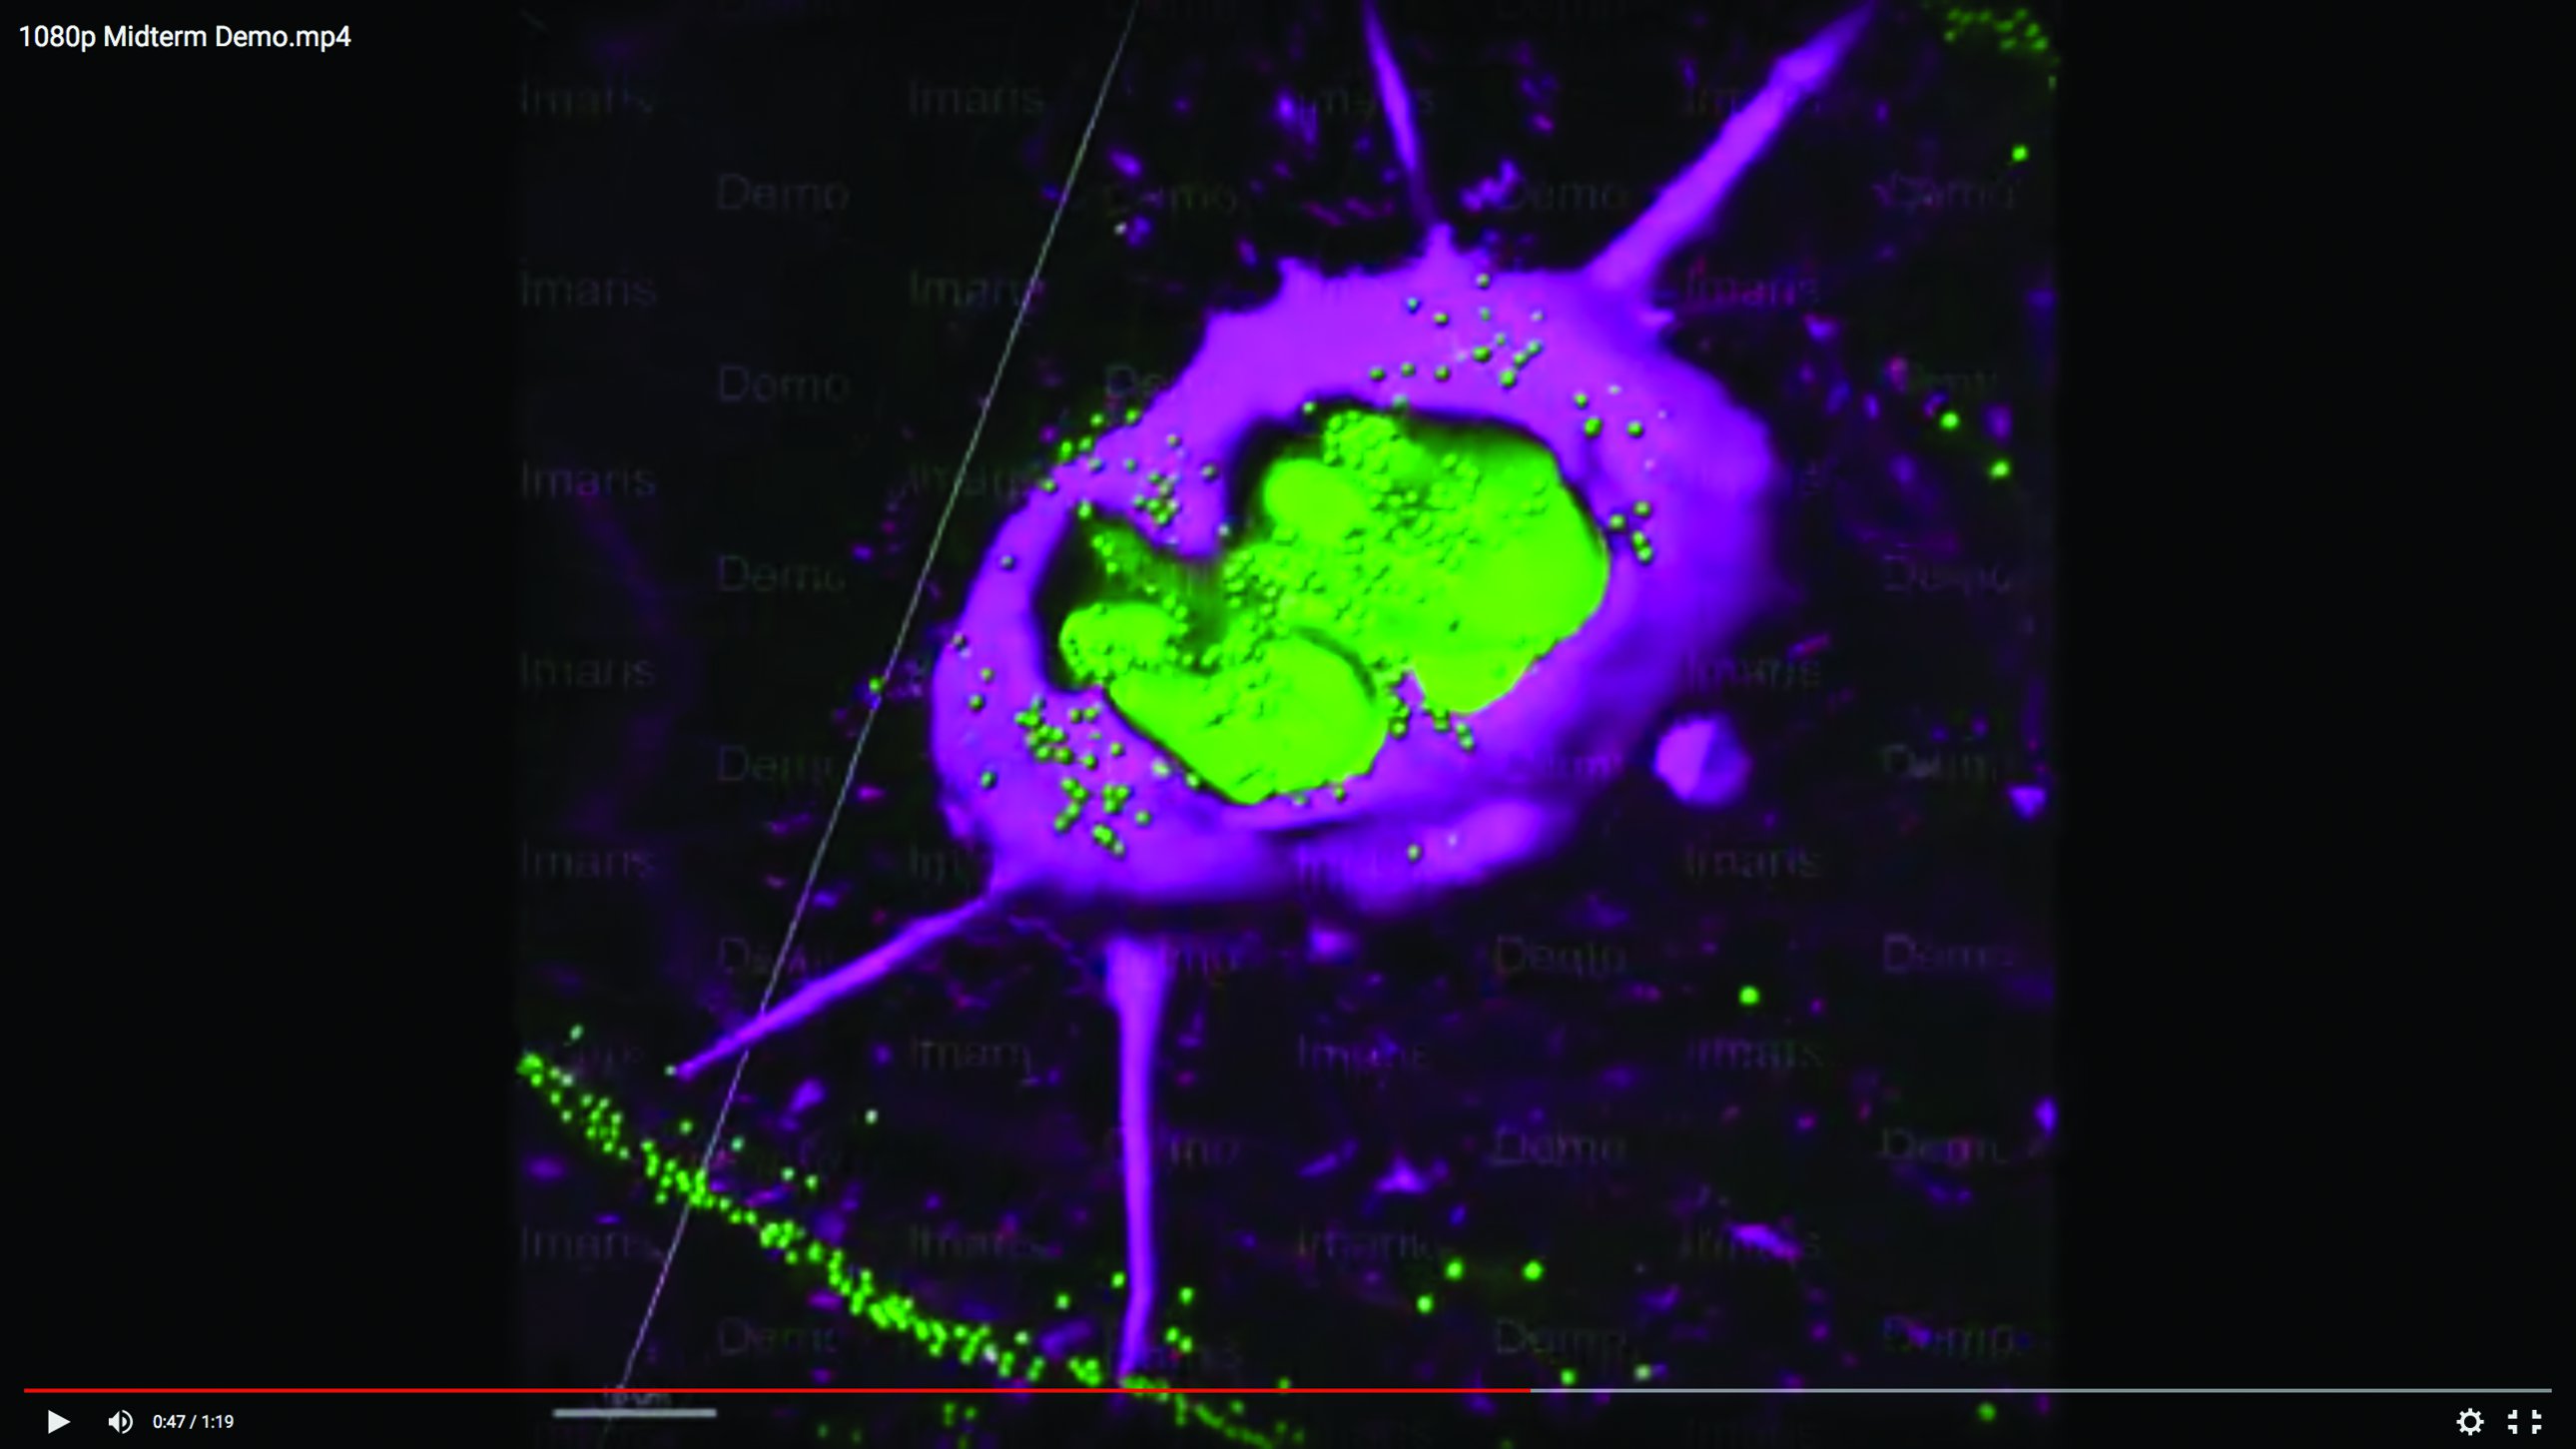
Caroline Zhang was asked by the NSF to present her research about barnacle formation in Washington, D.C. Image courtesy of Andy Mount.
Wole Oyekoya, who took over for Byrd when she left to join the faculty of Purdue University, says that in almost every field of science and scholarship, including the humanities, people are discovering the power of visualization and finding ways to use it. “I told the students that if this is an area you’re interested in, don’t be afraid to pursue it, because there’s going to be money in it,” Oyekoya says.
He leads me out of his office and down the hall to his lab, where one of his students, Barry Tucker, a student majoring in visual arts, is at a computer composing avatars. The avatars are 3-D representations of people whose forms will move and speak in realistic ways.
Animations like these are already proving useful in fields such as psychology, Oyekoya says, because a researcher can set up scenarios, including violent conflicts, and study how human subjects react without exposing anyone to harm. This kind of research would be unethical and impractical without visualization, Oyekoya says.
Parker Van Sickle, a senior in computer engineering, shows me an application for visualizing LiDAR (Light Detection and Ranging) data of the Clemson area, such as that collected via terrestrial or airborne LiDAR surveys. Airborne LiDAR is gathered by mounting a downwards-pointing LiDAR scanner on a low-flying aircraft and is used to gather high-resolution DEMs (digital elevation models) of the Earth’s surface.
Another of Oyekoya’s students, Joseph James, a junior majoring in mechanical engineering, hands me a headset and turns me loose to wander around in a 3-D model of the new Littlejohn Coliseum, now under renovation. I open doors, walk down a hallway, and step out onto the polished hardwood of the basketball court, where five imposing athletes, in uniform, are crouching and shifting in their stances, ready to defend their goal.
James asks me what I think.
“I think I’ve got no business on the court with these guys,” I say.
“That’s Not Good For You,” they said.
None of this virtual moving and shaking was possible a generation ago, except in rudimentary experiments using massive, exceedingly expensive hardware. Today, an ordinary desktop computer can render a coliseum and its occupants in three dimensions. But if you need to model, say, an ecosystem, a genome, or an earthquake-hazard zone, you’ll need big data and the services of a supercomputing center like Clemson’s Palmetto cluster, which can store and process terabytes and send them racing through the latest, fastest GPUs.
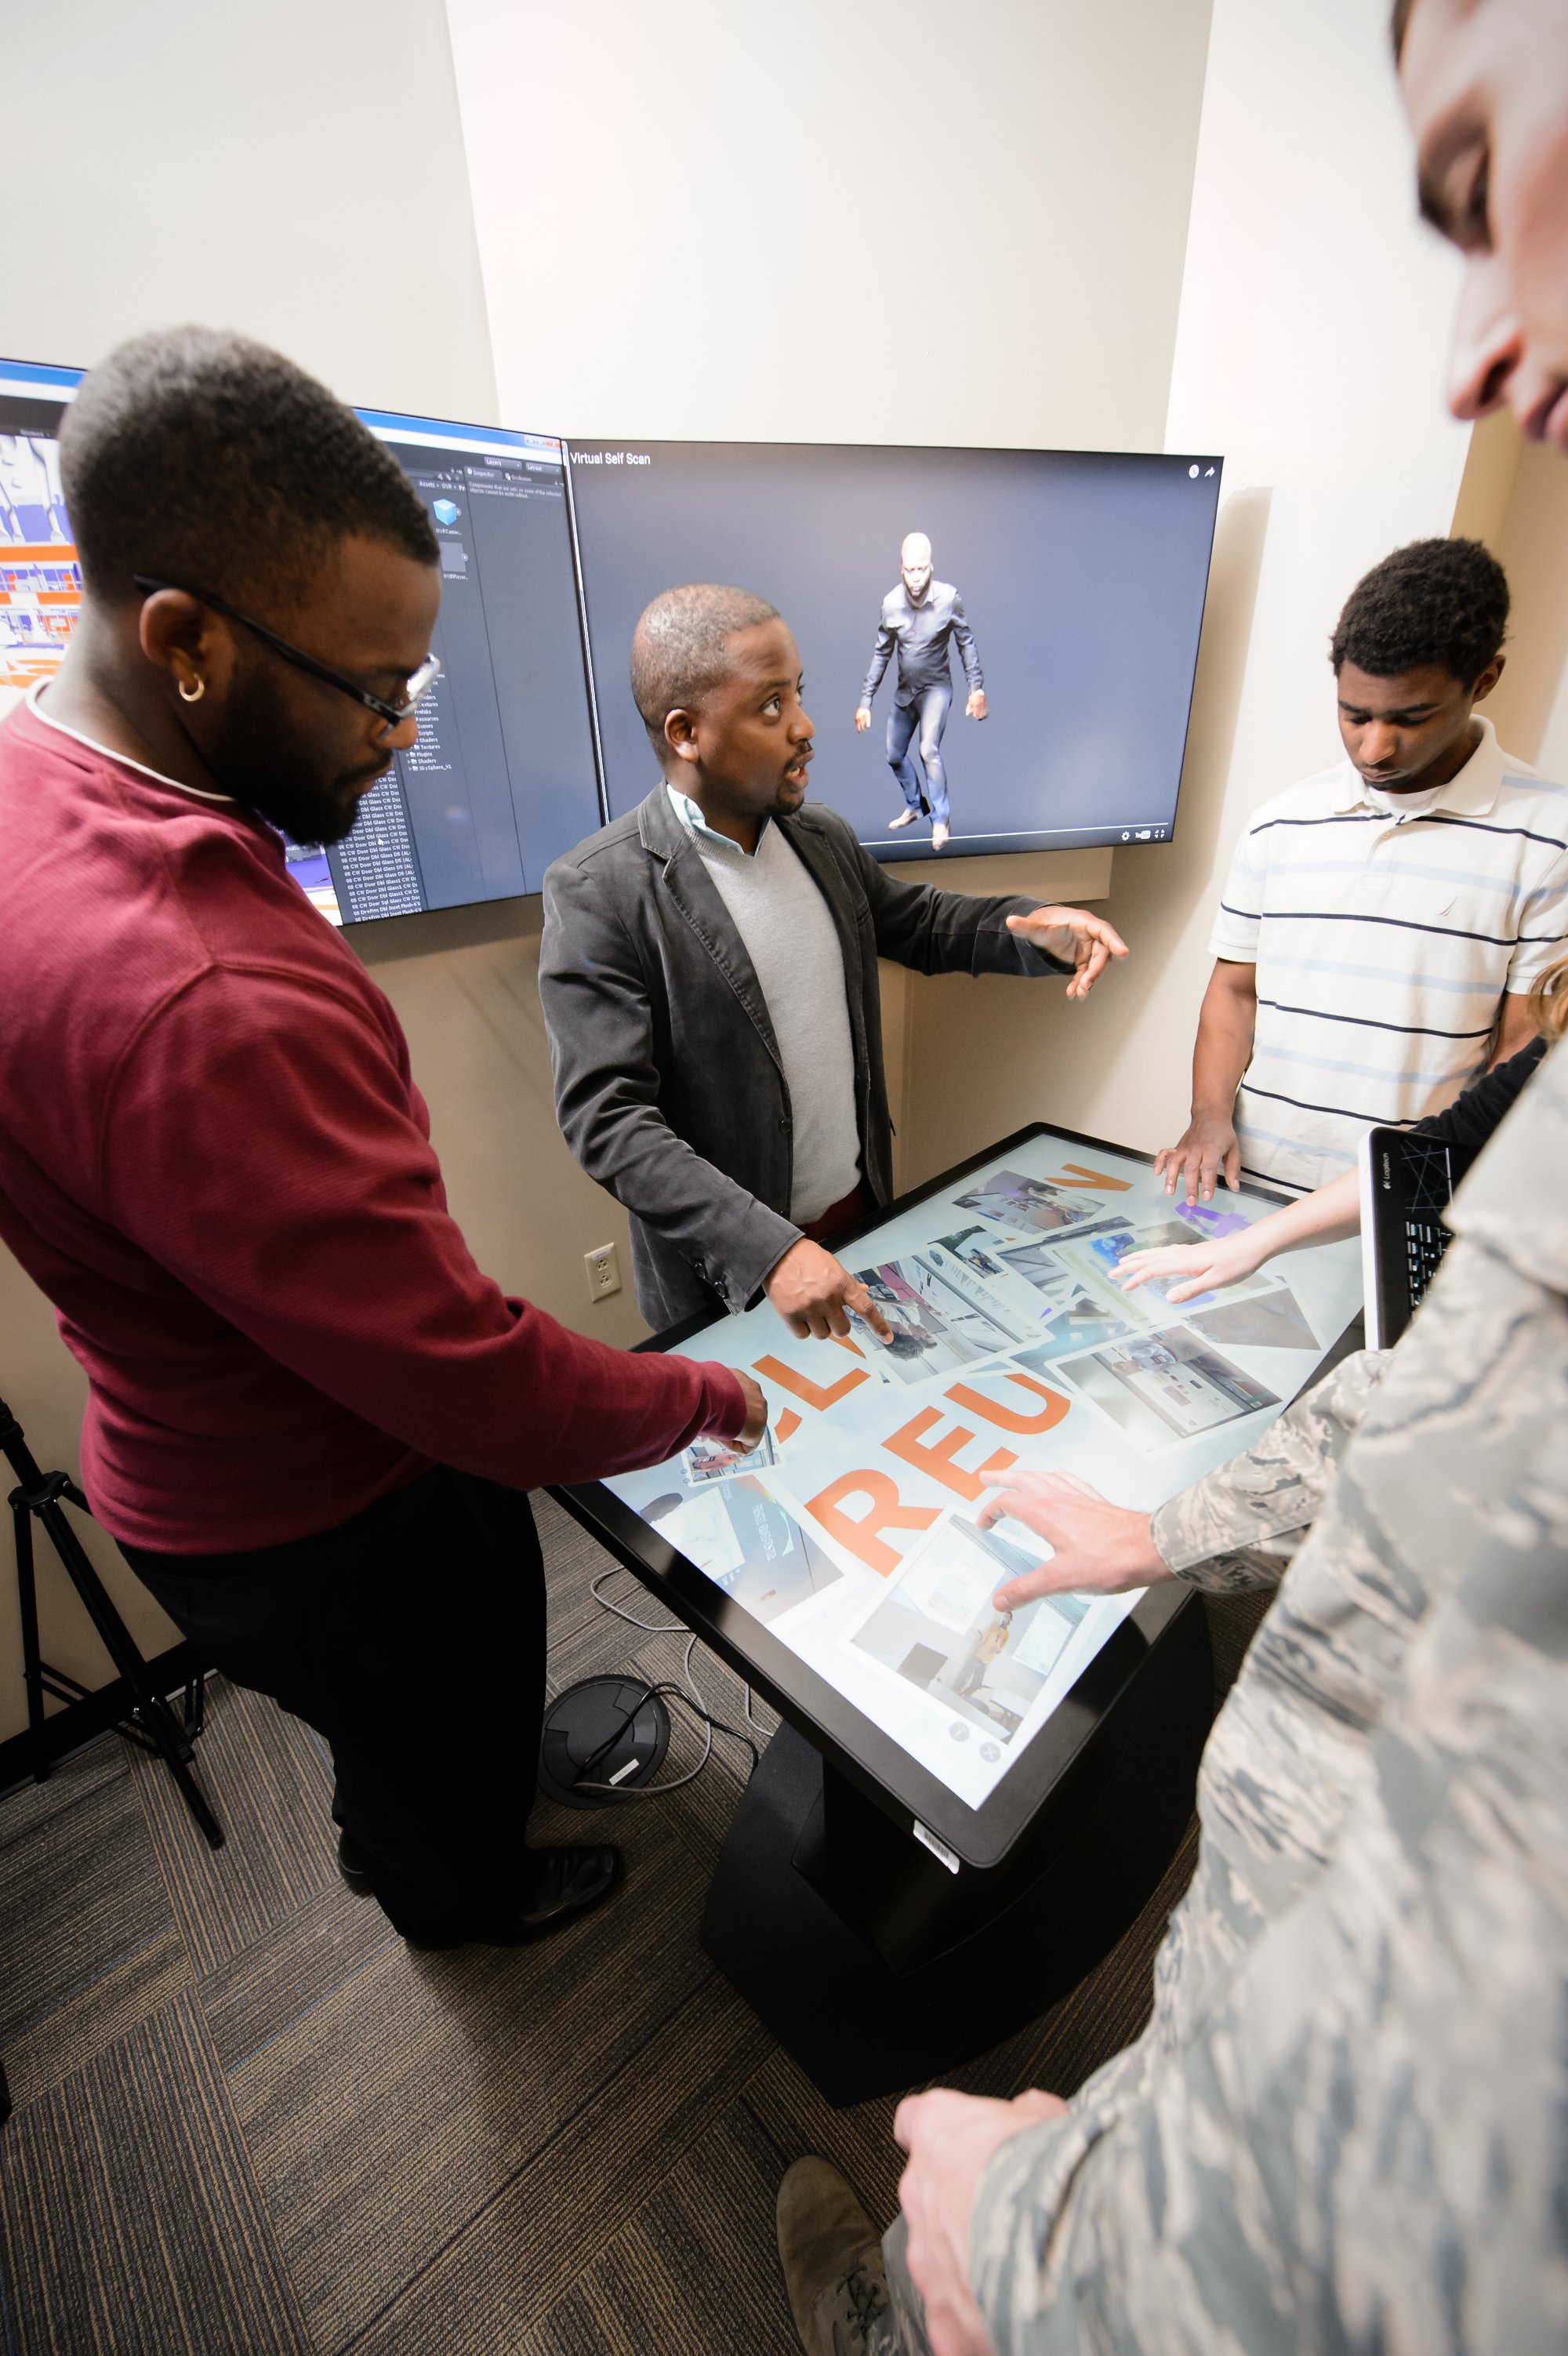
Here, Oyekoya works with students in his lab to develop 3-D avatars for use in psychology studies. Data visualizations have a potential application in almost every field. Photo by Craig Mahaffey.
I asked Oyekoya what happened, in just a few decades, to make all of this possible.
“It’s been driven by gaming mostly,” he says. “Over the years, these cards, these GPUs, have really become computers on their own.”
Oyekoya’s parents, like so many others, took a dim view of video games and warned him not to waste his time on them. “That’s not good for you,” they told him. Now it’s his job to help scholars and scientists fire up their GPUs and get into the game. “It’s a new area for me, to start delving into genetics, biology, and chemistry,” he says. “How do you talk to the researchers, understand what they need, and then be able to visualize it for them?”
That struggle to understand another field of study, to collaborate across disciplinary lines, is another way in which visualization is reshaping the scientific enterprise. People from very different backgrounds are finding common ground in the potential of GPU technology. Andrew Mount, who is both a biologist and an amateur astronomer, mentored a second REU student—Paris Smith, a senior mathematics major from Jackson State University—who rendered spectrographic tracings of solar storms and bursts of energy from Jupiter. Mount uses lasers in his biological research, and he says visualizing the data from those studies is much like visualizing data from space.
“When you analyze energy, whether it’s energy from Jupiter or energy from the sun or laser energy, the rules of physics are the same,” Mount says.
The methods and tools of visualization, Oyekoya says, have value in every field of scholarship and science, even in the humanities. One of the REU projects, mentored by Gabriel Hankins in English, visualized literary correspondence by detecting patterns within large collections of letters. Whatever the topic, visualization tends to attract bright, ambitious students who yearn to solve big problems, to answer questions too complex for any one discipline to tackle alone. Several of the researchers I spoke with about the REU summer internship program told me that their student interns came in with little or no expertise in the discipline and, before the summer was over, made real contributions to work in the lab.
Shaking skeletons apart
For the students and their mentors, the issues at stake are not trivial. Visualizing a complex problem in science could help protect property and save lives.
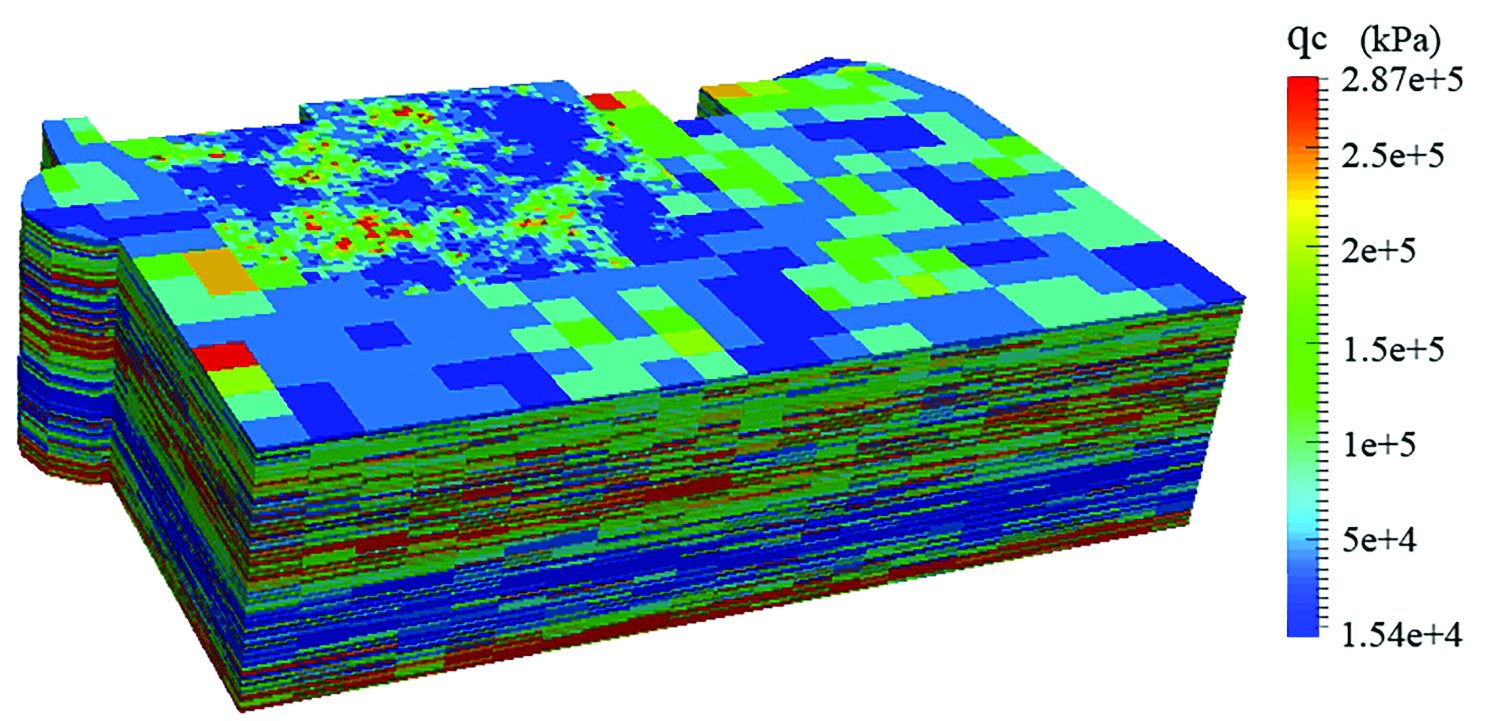
Chen’s map of the San Francisco Marina District enables quick analysis of which regions have higher potential for soil liquefaction in an earthquake. Chen says, “That’s something you cannot get just by using the data itself, or by using curves.” Image courtesy of Qiushi Chen.
Qiushi Chen, a civil engineer who studies soils and other natural materials, has been researching the risk of earthquake damage in Charleston, South Carolina, which occupies an active seismic zone. Chen explains that much of the catastrophic damage we see after earthquakes—cracked buildings and fallen bridges, for example—actually occurs as a result of liquefied soil.
Here’s how it works: An earthquake sends a jolt of pressure through the earth. If the soil is full of water—from rains, floods, or high water tables—this pressure wave can dramatically increase pore water pressure within the soil in a very short time and eventually break what Chen calls the soil’s skeletons, the structured particles that form when grains of sand or silt or clay combine. The skeletons, he explains, make soils strong enough to bear the weight of a building. But when the skeletons break down, the tiny soil particles flow like water, behaving more like a liquid than a solid, and the building can fail. This liquefaction, Chen says, is the biggest threat in seismically active coastal areas, where water tables tend to be high and the risk of liquefaction is great.
As sea levels rise, pushing the water table higher in some coastal soils, can communities like Charleston protect themselves from the destruction of a catastrophic quake?
Their chances are better, Chen says, if they understand their soils. Chen uses data generated by his colleague, Ronald Andrus, who has been sampling the soils of the Charleston area using metal cones equipped with sensors. Driven into the ground, the cones can measure soil resistance, which indicates strength, at various depths.
Andrus has conducted hundreds of these tests in the Charleston area. Chen uses the data to develop computer models that can delineate soil profiles at several depths throughout the area of interest and stores his data in the Palmetto cluster.
“So then we need to visualize the data,” Chen says, “and that’s where the student comes in.”
Chen’s student intern in the REU program was Janet Mendoza, a senior from the University of Puerto Rico. Mendoza took output from the computer models and reformatted the data to something that could be read by the visualization software, in this case a program called ParaView.
“So what we have now is a three-dimensional visualization of a soil profile from a given region for the area we studied,” Chen says. “That profile is important for seismic analysis because you can link the resistance of soil to the potential of liquefaction during earthquakes.”
Colors in the visualization indicate how strong or how weak a soil is, so it’s relatively easy to identify an area that could liquefy in an earthquake.
“That’s probably the area we should pay special attention when you’re designing foundations,” Chen says.
In September 2015, Chen’s group published a liquefaction potential map, generated using Mendoza’s visualization tool, of the San Francisco Marina District. “By looking at that map in different colors, you know which area is potentially liquefiable during an earthquake,” Chen says. “That’s something you cannot get just by using the data itself, or by using curves.”
Are there locations in Charleston that seem especially vulnerable?
“We’re still working on that,” Chen says. The researchers need more samples to define the hazard zones with certainty. As more data roll in, the lab will develop its models and apply the visualization tool that Mendoza developed last summer.
“She did an excellent job,” Chen says. “She’s an undergraduate student in computer science with no prior training or background in civil engineering. But it’s amazing how well she handled this project.”
Leaf by leaf
When it comes to the ecology of forests, Bo Song has turned over a new leaf. She uses visualization to understand how forests evolve and what threatens their health.
Understanding a tree for a forest
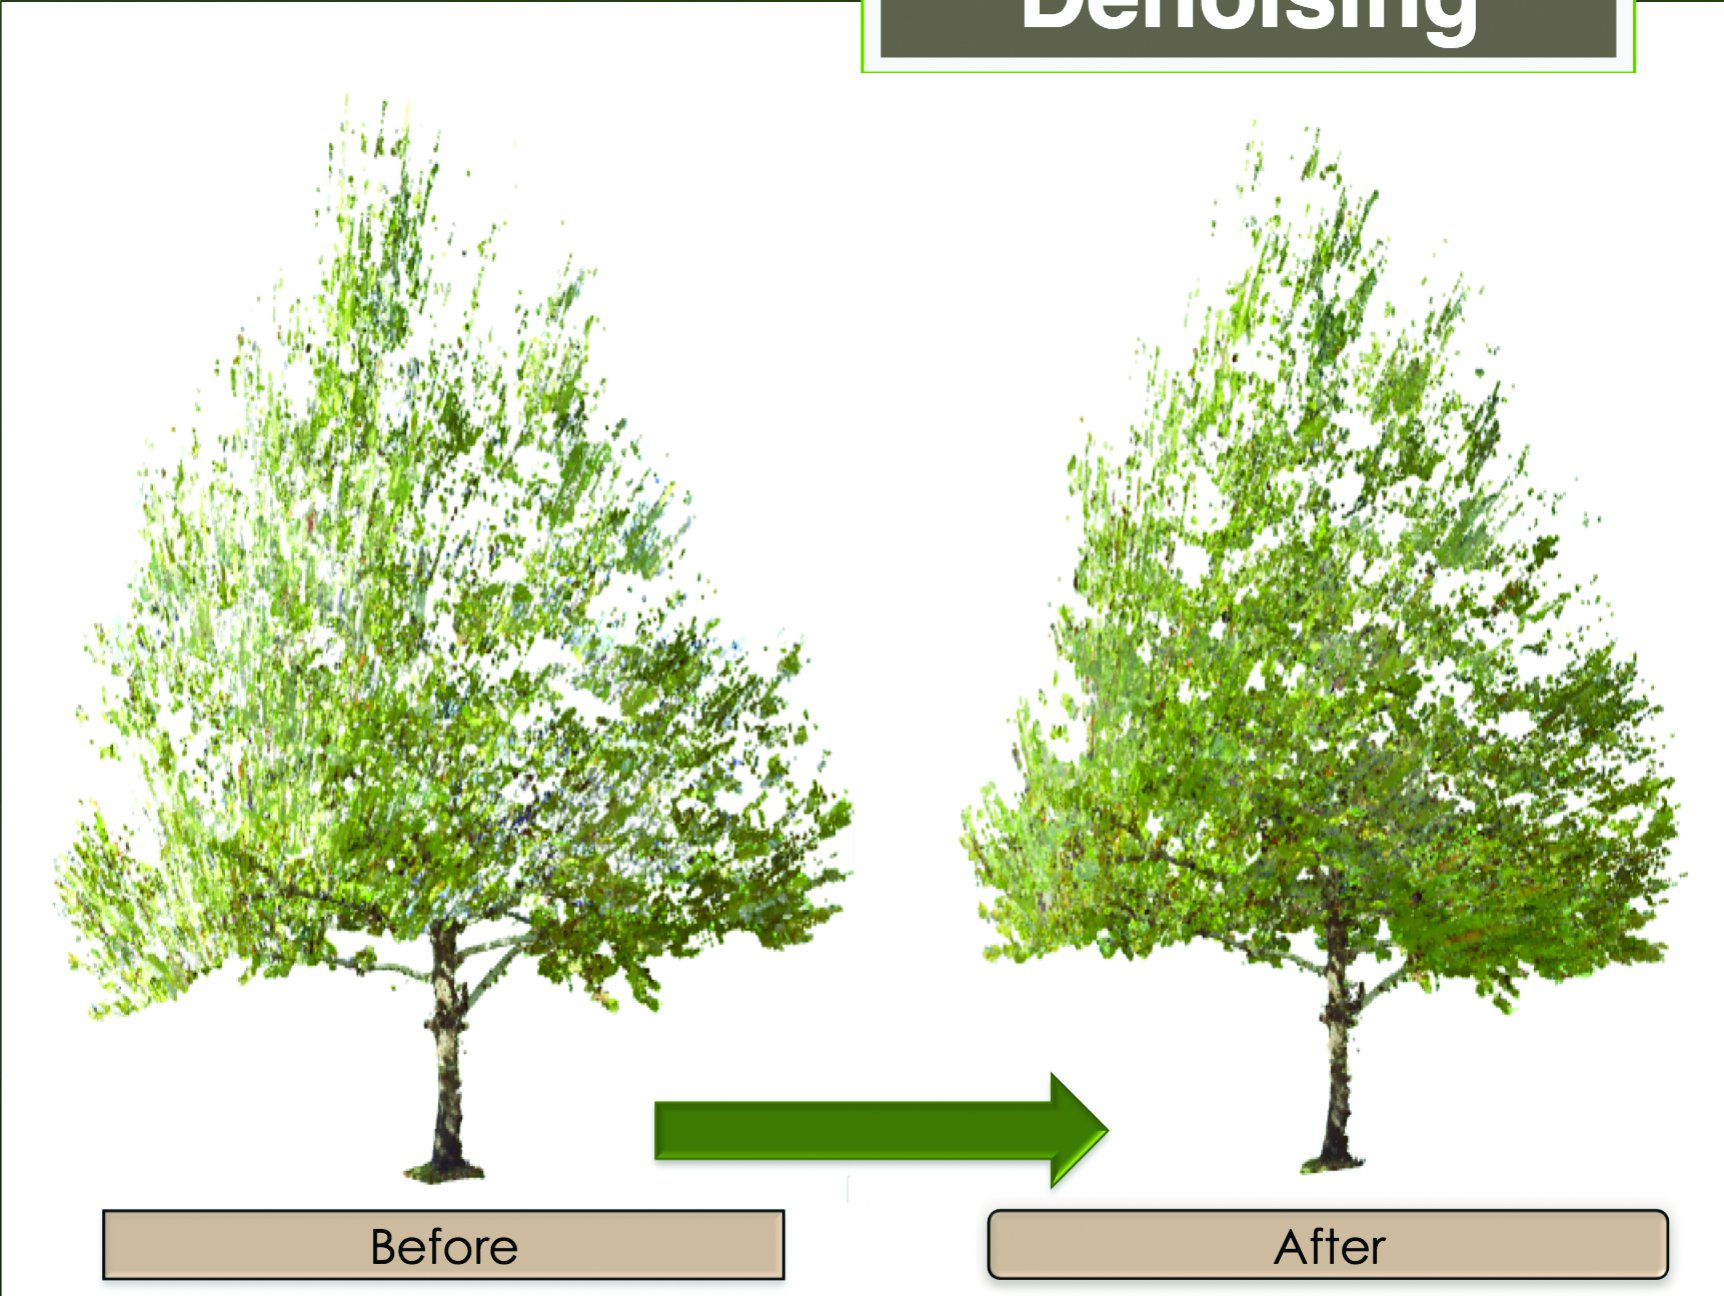
For eight weeks last summer, Song’s lab scanned a single sycamore tree, taking measurements to calculate the tree’s changing volume as it dropped leaves. Precise data regarding specific species will help researchers make accurate predictions about larger issues, like how vegetation will fare in the face of climate change. Images courtesy of Bo Song.
“We can visualize a hundred years of forest change in three dimensions on a computer,” she says.
The dynamics of modeling allow her to study, for example, forest succession, from herbs and shrubs to forests. She can also simulate the spread of forest fires or beetle infestations. And visualization, she says, is especially useful in outreach and extension programs.
“With visualization, you can show the tree, the different forest structures, the whole topography, and the different management options,” she says. “That helps people understand.”
To gather data, Song’s lab uses a laser 3-D scanner, which can measure with pinpoint accuracy the objects and textures within its range. This is the type of scanner used in law enforcement to capture the details of a crime scene, in the construction industry, and in science. It can also be used to study beach erosion and changes in sand dunes. A similar scanner tracks progress as conservators at the Clemson University Research Institute remove encrustations from the hull of the Civil War submarine, the H.L. Hunley.
For the REU program, Song was a mentor for Shayne O’Brien, a student from the State University of New York, Geneseo. “He has a mathematical background, and he helped us to figure out the math,” Song says.
Last summer, Song’s lab aimed its scanner at a single sycamore tree. “For eight weeks, we took a measurement every week,” she says, “and we use that to calculate how leaves were dropping to ground. Using the scanner we could not only visualize the tree in three dimensions but also calculate its volume. That’s very accurate scanning and very detailed.”
The scanning wasn’t as simple as it sounds. Light reflected from the tree and its surroundings sometimes left gaps in the data. O’Brien helped Song calculate and account for those gaps and complete the image. O’Brien’s paper about the work was accepted by two conferences and one publication, Song says.
Song says visualization has enormous potential in ecology, which requires vast troves of data to help researchers grasp the complex interrelationships of plants, animals, climate, and terrain—from the microscopic to the global.
“For ecology, it’s really hard to figure out all the factors,” Song says. “For example, let’s say we want to know how climate change will affect a forest. If I put in one degree of temperature increase, what will that do to the different types of vegetation? How will different forests relocate over time as some species disappear or invasive species come into the system? All of this we can predict, but if you don’t have visualization you can’t see it. And if we want to have a plan, we can basically realize it on the computer. And this is not only educational. It’s like playing a game. But it’s a game that provides ecological knowledge.”
The hurricanes in genes
For Alex Feltus, the name of the game is how to feed a hungry world. Feltus studies how genes interact, primarily in food plants such as corn, rice, and soybeans. “I try to find little sets of genes that are important for the crop, for bigger rice grains or increased drought tolerance, for example,” he says.
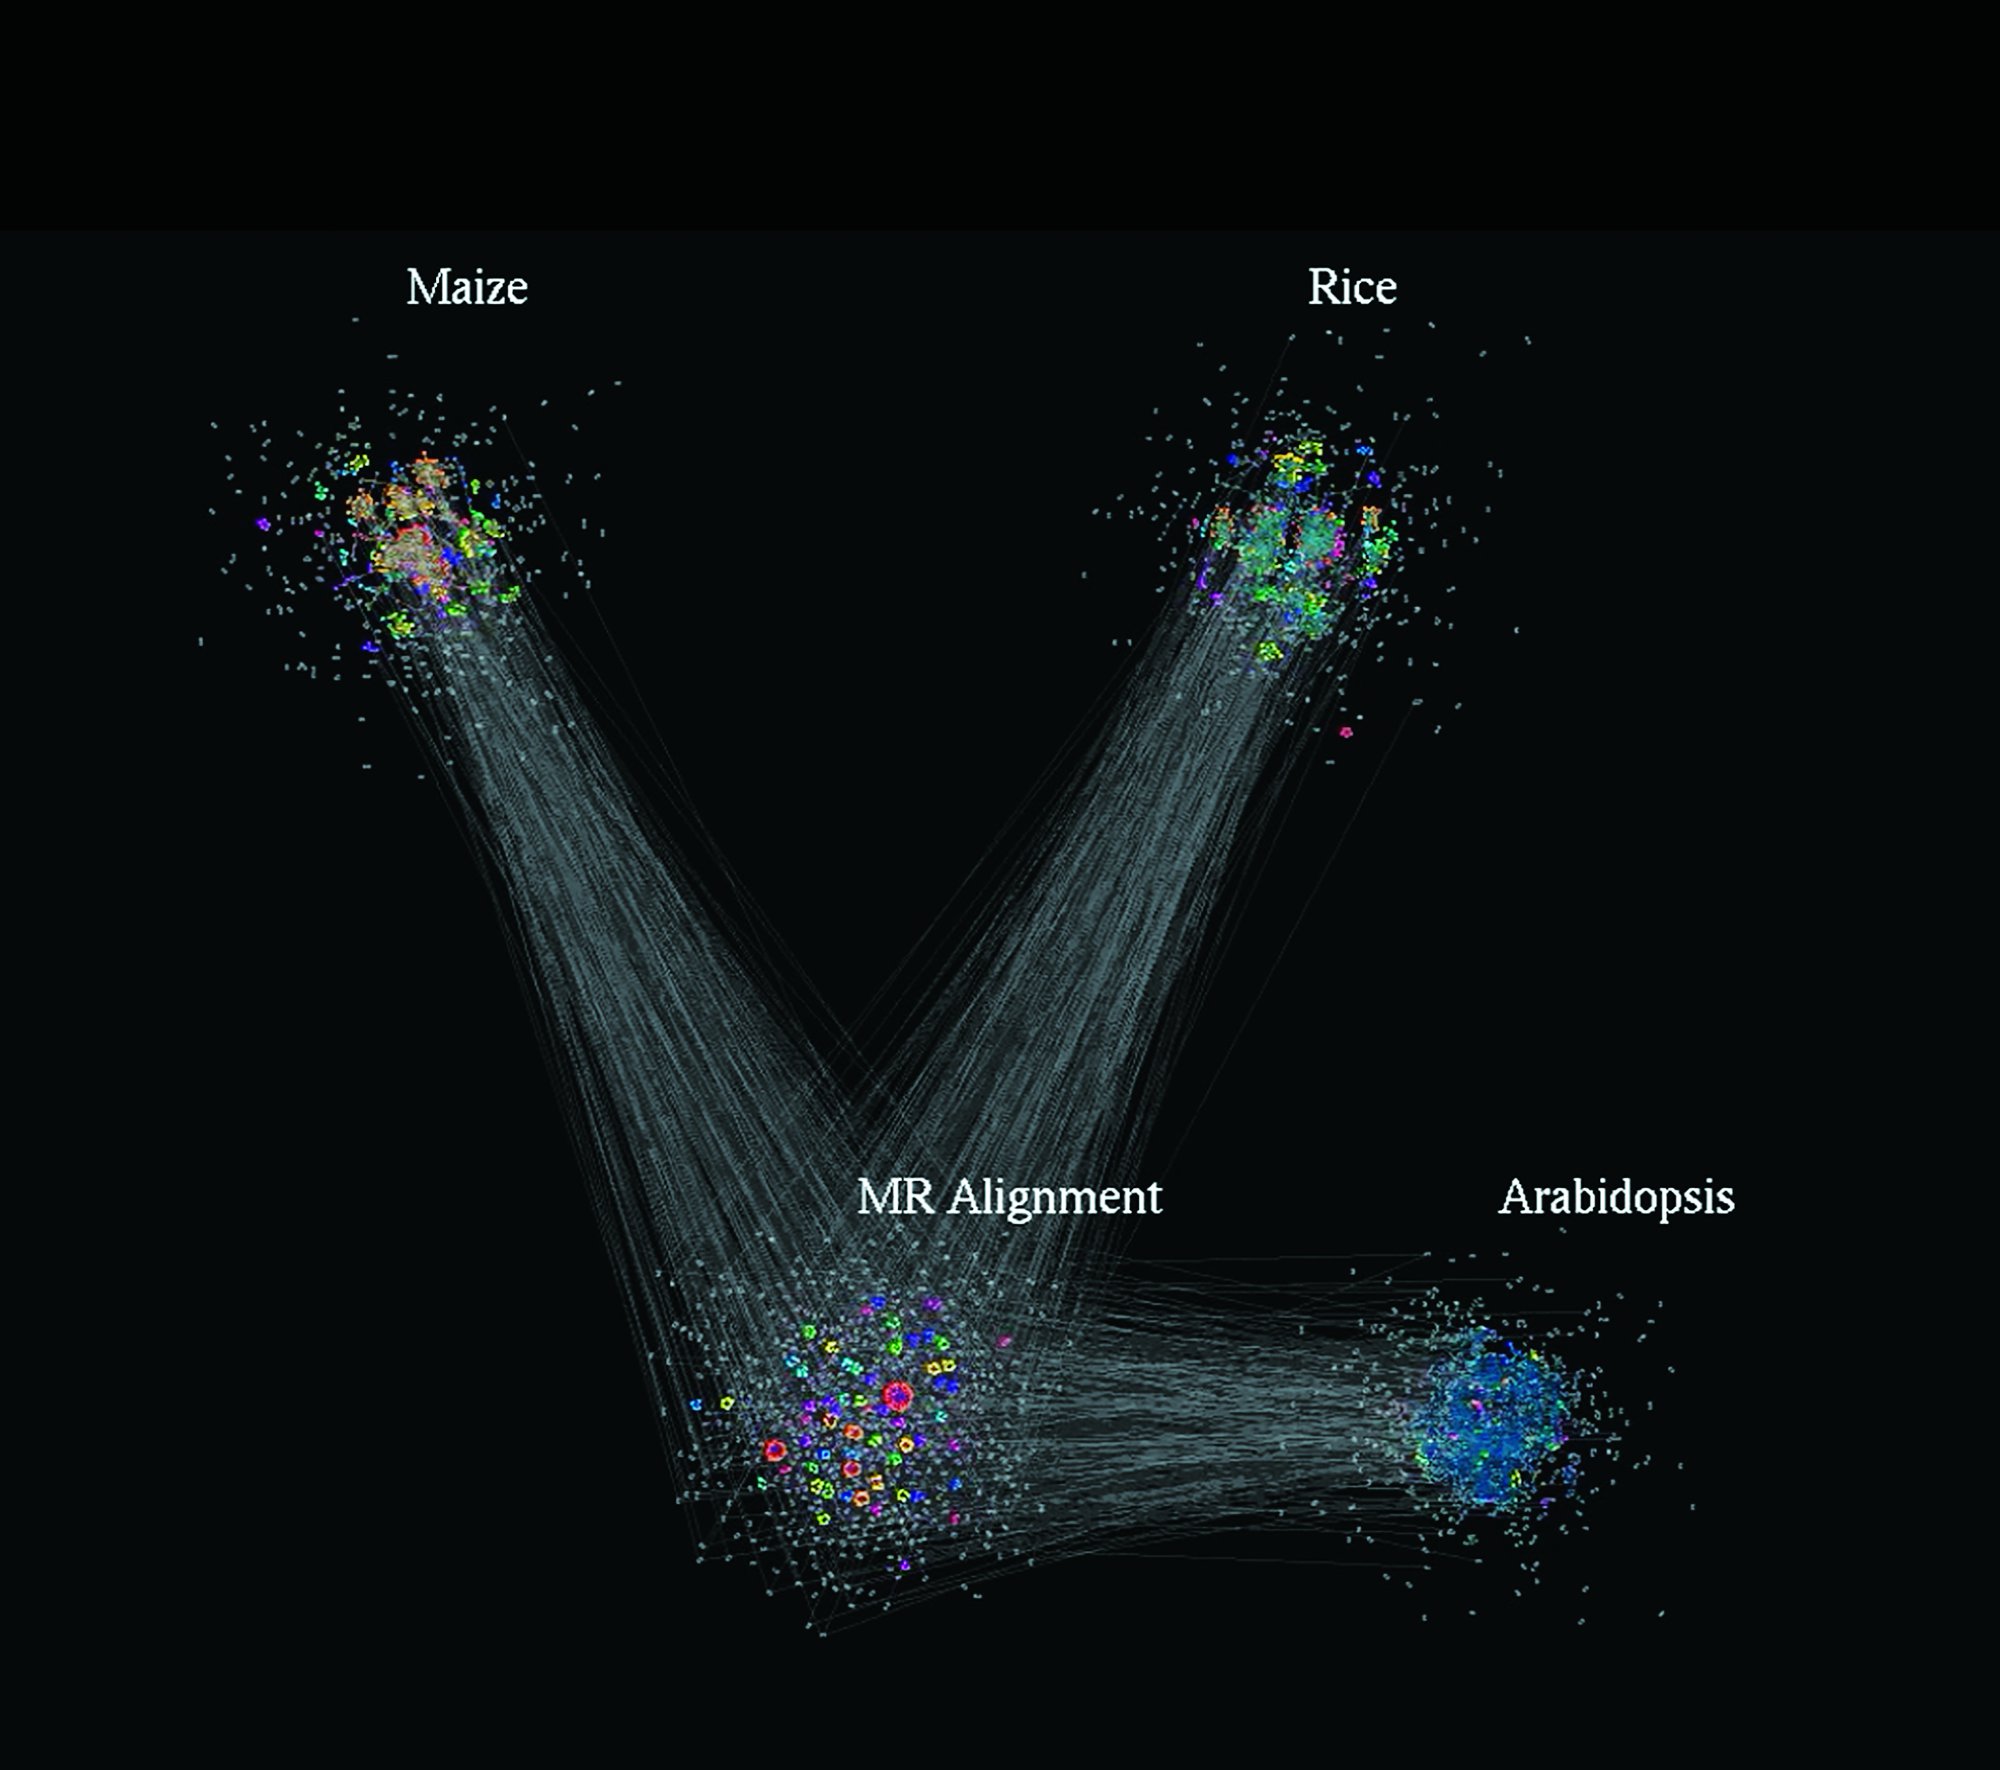
This image, taken from the animation that Feltus shared with Glimpse, reveals networks of genes connecting in nodes. Visualizations like these can highlight deep connections in huge arrays of data.
Because he’s typically looking for interactions among some fifty thousand genes or more, the patterns are exceedingly complex. He compares the task to what meteorologists face when they model the weather. “I’m trying to do the weather patterns of gene interactions,” he says. “I’m trying to find the little hurricanes. I’ve reached the point where I can’t even understand what I’m doing unless I can visualize it in some way.”
The need for visualization led Feltus to Melissa Smith in electrical and computer engineering, and to Smith’s Ph.D. student, Karan Sapra. Smith’s lab has found that when it comes to visualization, GPUs can often supply the primary brainpower, cranking through data faster and better than a CPU, a computer’s central processing chip. But to render the images of science instead of, say, a high-speed car chase, GPUs also need special instructions. For the genetics research Feltus is doing, that means writing software to access the data and take advantage of the GPU.
“I work with Melissa to develop visualization tools using GPUs, which are chips that were invented for video games,” Feltus says. “Now those chips are providing the infrastructure for visualizing complex scientific data, too.”
Genetics is complex not only because of how its puzzle pieces fit together, but also because that puzzle changes over time. As an organism develops, thousands of genes get turned on or off at various moments, in various ways. “They’re little switches,” Feltus says. “When you put a seed in the ground for a rice plant, the genes are activated. It starts to grow stems and leaves, and eventually flowers and produces more seed. There might be thousands of genes that affect yield, but there are two of them, or maybe a hundred of them, that are important. The goal is to breed the right rice plants together to get the right combinations of genes and alleles.”
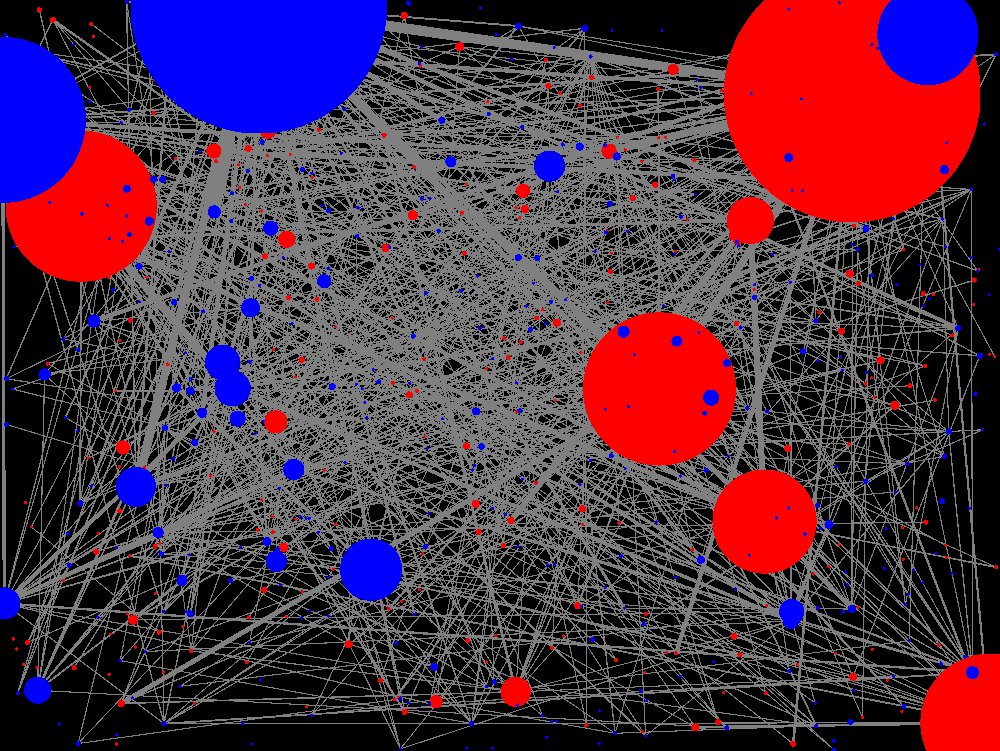
“It’s a new way of doing biology,” Feltus says of visualizations like these, that reveal networks of genes. Image courtesy of Feltus.
He shares a link to an animation showing networks of genes connecting in nodes over time. The image is lovely, and unfolds like something organic and living, but it is not a video. It is an animation revealing the deep connections in huge arrays of data, showing Feltus the relations of genes.
The networks are so complex that even with visualization they can overwhelm the eye. For the REU program, Feltus and his colleagues worked with two students, Kathleen Kyle from Florida State University and Amari Lewis from Winston-Salem State University, to map the nodes into simpler shapes that could serve to highlight points of interest.
“It’s a new way of doing biology,” Feltus says of visualization. “People have always studied biological systems. Aristotle studied biological systems, but he couldn’t see the genes. Mendel couldn’t see the genes; he could only see the phenotype.”
It is the seeing, Feltus says, that makes the data meaningful. To explain, he returns to the weather analogy. “If you could have Doppler radar for every location in every state, then you could really get high-resolution views of a complex system,” he says. That’s the general idea behind his high-resolution views of genetics. Like many of his colleagues in visualization, Feltus uses the Palmetto cluster for the high-performance computing necessary for his genetics research. As chair of the cluster’s faculty advisory board, Feltus has seen the wide range of applications for extracting trends and patterns from the massive arrays of information known as big data.
“When we get together, and I meet with all the researchers, everybody’s doing completely different stuff,” he says. “Side by side with my genomics work you see people modeling how fire propagates, or doing remote surgery and processing the images. Economic data is going through there—all sorts of stuff. So in all of these different fields, computers have opened up the possibility of studying an entire complex system, not just one tiny part of the system. So you can go to the computer and model what you think is going to happen before you actually do a physical experiment, to get predictions of the outcome. It’s pretty amazing.”
I ask him if visualization will help the public better understand the science of genetics, climate, or any other complex system. “I think it could help people accept the fact that things are complex,” he says. “It’s like seeing the Earth from the moon. You’re not just describing it for someone who has never seen it. You are seeing it in a whole new way.”
Qiushi Chen is an assistant professor of civil engineering and Ronald Andrus is a professor of civil engineering in the College of Engineering and Science. Gabriel Hankins is an assistant professor of digital humanities in the College of Architecture, Arts and Humanities.
Where science and fiction cross paths
by Neil Caudle
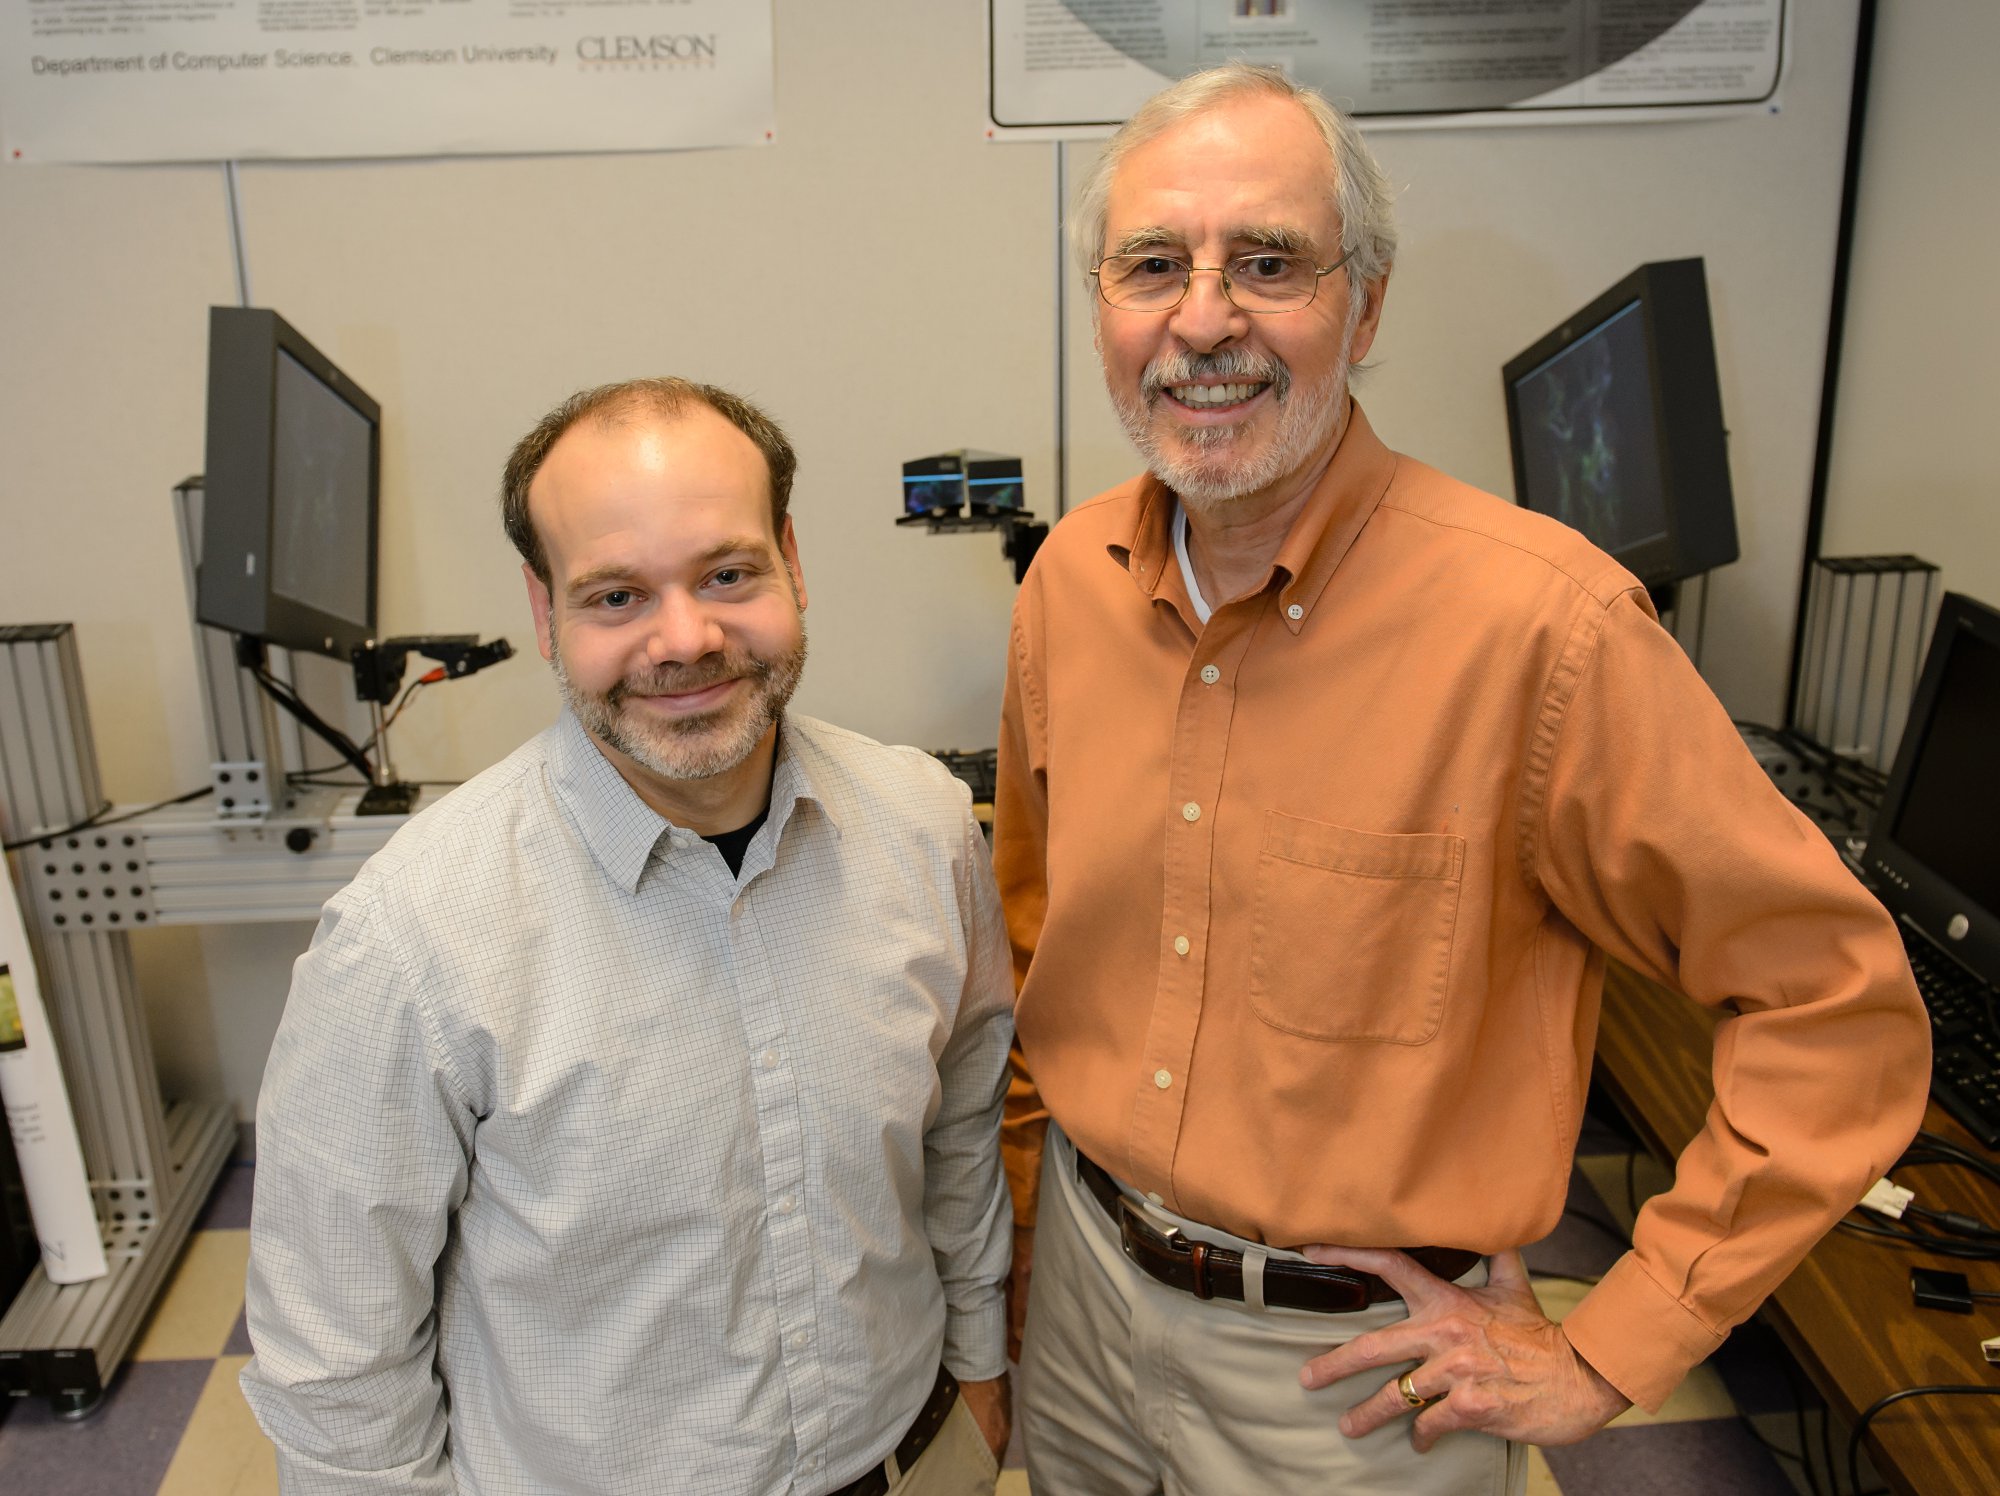
Photo of House and Levine by Craig Mahaffey.
Not so long ago, serious science didn’t truck with the fanciful fictions of movies and games. Things have changed. Today, the realms of fact and fiction share a toolkit and the experts who know how to use it. Joshua Levine and Donald House are two of those experts— computer scientists who, in the course of their careers, have worked both sides of the street.
House developed a method of choice for simulating woven cloth in digital animations, and you’ve probably watched the drape and flow of his work in popular games and films. But he also understands scientific research. He has studied the science of depth vision in frogs and toads, research that inspired a 3-D graphics system called Jabka. And at Clemson these days, his collaborators are mostly scientists. With support from the National Science Foundation, he works with the National Hurricane Center to improve how hurricane predictions are rendered, to help emergency managers and the public make good decisions when a hurricane’s coming to call.
Levine has teamed up with Robert Geist, a computer graphics wizard known for his work on films such as The Hobbit: An Unexpected Journey, to simulate fractures, as in shattered glass or cracking stone. Geist and Levine are using a particle-based approach, meaning that they compose the material from a carefully constructed array of points—or particles—set to move around in space. Once the researchers work out the geometry, and the points are all moving as planned, the computer can flesh out the fragments of glass or stone, or most any other breakable material.
“We want to make something that looks good, that you’d be able to use in a movie,” Levine says.
Meanwhile, Levine is taking the project in a very different direction, developing tools that scientists could use to input and model their data, applying the particle-based approach. “We use a similar toolset,” Levine says, “but the graphics folks are focusing on the entertainment industry, and I’m focused on the scientists.”
This kind of back-and-forth across the great divide of fantasy and science has become business as usual, Levine says. Computer graphics types scan the literature of science and technology for breakthroughs they can use to amp up the atmosphere and action in their animated films and games. Then scientists figure out a way to put those graphic innovations to work in their research, through data visualization.
A blizzard, flake by flake
The visualization field got its start during the mid-80s, Levine explains, and gained official recognition from an NSF report published in 1987. People working with the national research laboratories, and with the Department of Energy in particular, took an interest in tools that could tap into the power of the computer graphics technologies transforming modern entertainment. “People at the labs were asking, ‘Can we do things that benefit not just games and movies but actually forward scientific progress?’” Levine says.
The answer turned out to be yes. Data visualization has become, in one generation, a considerable asset for modern science. That’s because big science often means big data. If you’re parsing a genome or predicting the impact of climate change, for example, you’ll have to grope your way through a blizzard of data. Visualization can help you navigate the storm and make sense of its patterns, right down to the shape of each snowflake.
But to make those patterns clear, you’ll have to do the math. And you’ll have to understand the nature of human visual perception.
Donald House can do both. He has learned not only how math can weave cloth but how our brains weave an image from the light beaming in through our eyes. In many ways, what we actually see when we look at the world is a fiction, he says. Our visual system picks up the contrasting patterns of incoming light, and our brains construct a scene using memory and imagination. So even when we’re climbing a staircase or petting the dog, the realms of fact and fiction converge.
“Everything you see, you’re actually constructing in your mind,” House explains. “It’s not like a movie running in your head. Your eyes are constantly moving around and exploring, and through that exploration you’re building up this image of what you see.”
So when House works on a scientific visualization, he keeps the nature of human perception in mind. “One of the keys to visualization is understanding that contrast is what people are reading,” he says. “So when you enhance contrast, you enhance legibility.”
Take medical imaging, for instance. Using data from CAT scans or MRIs, House and his students are trying to improve the rendering of medical images so that it’s easier to see features of interest. “If you’re looking at bones inside a body, you might want to render the musculature so you can see where the muscles are in relation to the bone, and you might also want to see the bone,” House explains. “So you have one thing in front of another.”
The usual fix for this problem is to give the tissues on top some transparency in the image. “The problem with that is that it’s very hard to see clearly the shapes of the bone surfaces and the muscle surfaces, because they’re over the top of each other,” House says. “So we’re looking at ways of putting texture on the surface, a kind of pattern that makes it easier to see how the surface is curving in and out.”
He faces a similar challenge when he works on tools for hurricane prediction. The path and strength of a hurricane are uncertain, and the uncertainty increases with time. “The hurricane may look like it’s heading right for Charleston,” House explains, “but actually it might hit the Outer Banks. So people in the Outer Banks need to be aware of what chance there is that the hurricane may hit up there.”
The trick is to layer uncertainty into the visualization without making the image cluttered and confusing. That means carefully selecting the data that yield an accurate, meaningful contrast, House says.
A glut of granularity
For today’s scientific research, with its enormous data sets and models that incorporate multiple simulations, finding a meaningful contrast is easier said than done. Sometimes, there’s too much data, too many flakes in the blizzard.
This kind of overload is relatively new. A decade ago, Levine says, the problem in science was how to find enough computing power to generate the data at the appropriate scale to understand the subject of study. But as computing power increased, so did the data. Exponentially.
“Ten years ago, if you ran a climate simulation, for example, you might have been getting granularity of every fifty kilometers,” Levine says. “So every fifty kilometers, you knew what the temperature was. Now we can get the data at much, much finer resolution. The problem is, the resolution is too high. We’re generating more data than we ever thought possible, and the visualization tools are trying to cope with it.”
So the new challenge facing researchers like House and Levine is how to find ways to glean the data that are truly important and leave out the stuff that’s less relevant. Levine’s work with Alex Feltus and Ph.D. student Karan Sapra is one example. Feltus, a geneticist, is sorting through thousands of plant genes to decide whether pairs of sequences are similar or different. “What comes out of that simulation is a kind of element-by-element comparison,” Levine says, “and they’re trying to see what that comparison looks like, in the grand scheme of things.”
In genetics, that means reaching into a thicket of data and pulling out a few tiny morsels of meaning. By one school of thought, you can manage this kind of sorting with something called machine learning, which involves programming a computer to figure out what to keep and what to throw away. But visualization keeps the human being in the loop, Levine says, and that can be useful.
“There are things that humans do really well,” he says. “We’re really good at picking out patterns, if you present those patterns in the right way. So a lot of what visualization is doing now is not just processing more and more data, but doing some of that summarization.”
Where fact and fantasy converge
Whatever the task, most scientific visualization relies heavily on hardware developed primarily for computer graphics and video games. Companies such as Nvidia, AMD, and Intel have pushed the technology of graphics chips—called GPUs—to such speeds and capacities that they now constitute much of our hightech processing power, even in the supercomputers scientists use. One reason is the GPU’s capacity to handle multiple streams of data at once, in parallel; another is that the graphics chips tend to consume less power than their cousins, the CPUs. In a supercomputing facility, which can sometimes consume enough electricity to require its own power plant, the energy savings add up.
Because of these advantages, the modern GPU, like the human brain, is a place where fact and fantasy cross paths. The same hardware that serves the computer graphics side, and the fanciful creations of people like Geist, also serves the science side, including the data visualizations of House and Levine. (Clemson, which has received research support and equipment from Nvidia, has been designated an Nvidia GPU Education Center and a GPU Research Center.)
It’s a new blend for a new age, and it has opened up a world of possibilities for students, so long as they’re willing to take on the rigors of math and computer science. The same basic skill set can equip them for careers in science, entertainment, or both. Josh Levine and Don House are living proof.
I ask House about how he’d made the transition from working with filmmakers to working with scientists. Wasn’t that a leap? “Here’s the main difference,” he says, laughing: “The people making films are trying to do their best to create an illusion of reality that isn’t really real. The filmmakers want to show you a huge explosion, even though it’s just a firecracker. But the scientists want you to do your best to show them the data without changing anything. They don’t want anything you’ve invented; they just want to see the data. So it’s totally the opposite of what the film people are doing. It’s all in the audience. It’s all in your point of view.”