a map for conservation
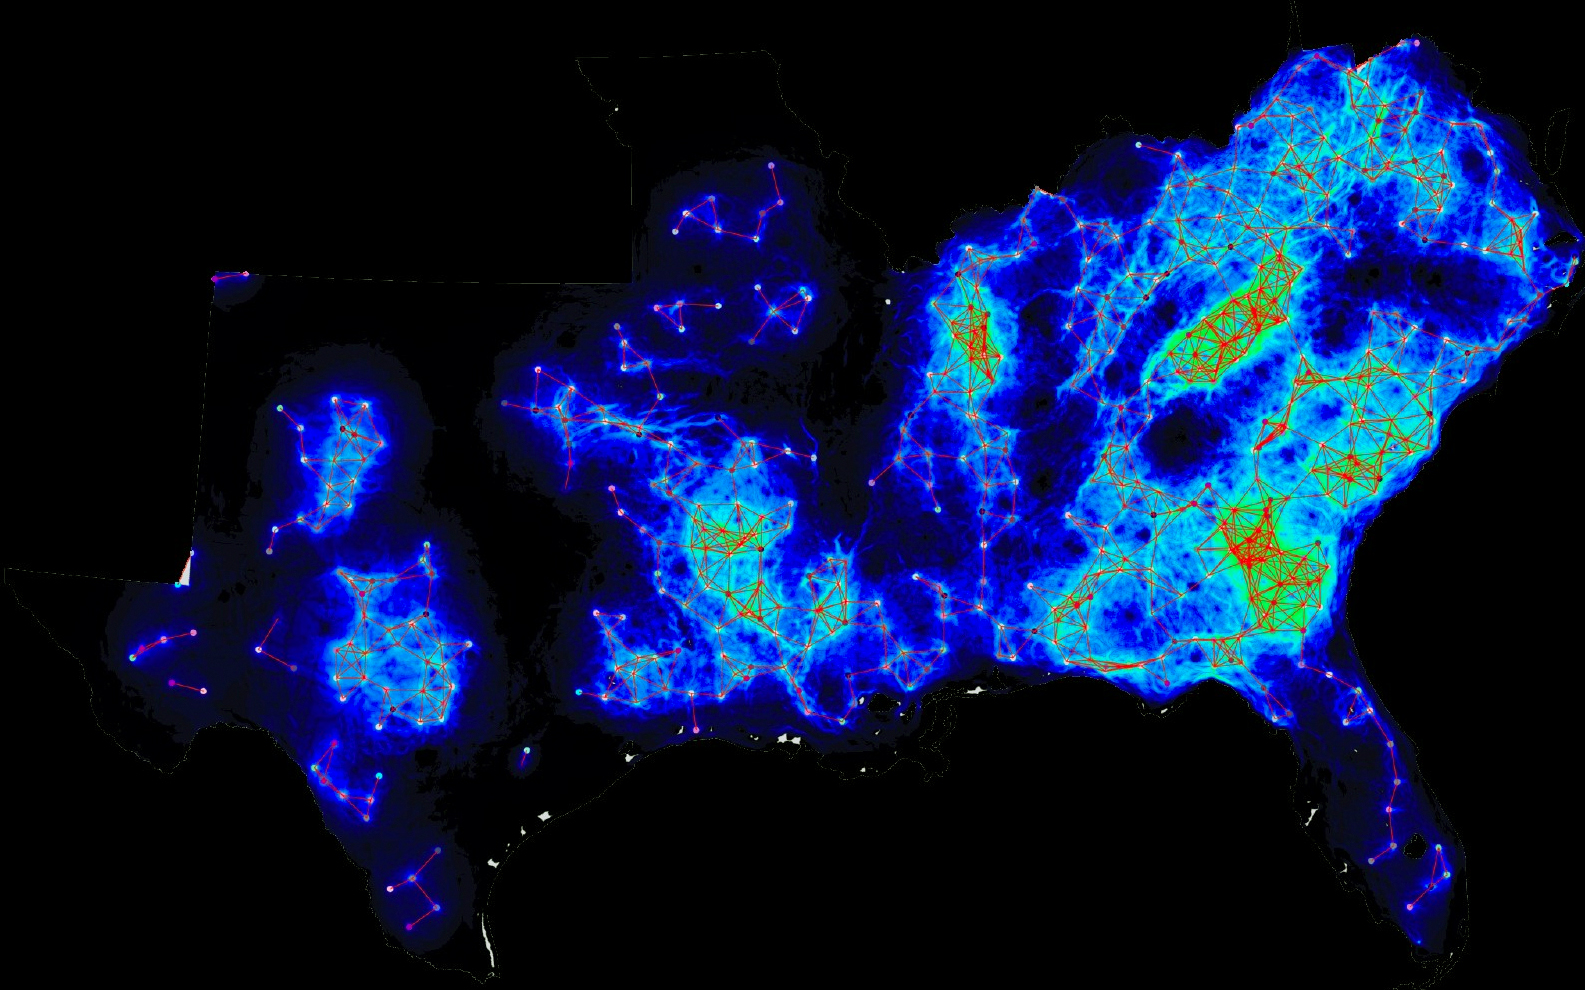
This habitat connectivity map, created by Paul Leonard, a postdoctoral fellow who works on conservation planning in the Baldwin lab, funded by the Appalachian Landscape Conservation Cooperative, shows the routes of animals like black bears, timber rattlesnakes, and Rafinesque big-eared bats.
Off-the-shelf software would’ve taken two and a half years to compute the millions of linear algebraic equations used to generate a map like this. But using the Palmetto cluster supercomputer to combine billions of bytes of data, including satellite photographs and the information from hands-on fieldwork, Leonard produced maps in a mere two days. These geospatial maps, which model habitat connectivity for South Carolina and the southeastern United States, account for habitat corridors and ranges as well as natural and artificial areas “resistant” to animal movements, such as mountains, rivers, cities, and highways.
Due to the map program’s ability to zoom in and zoom out, Baldwin, who works closely with Leonard, says, “We can see patterns influencing local animals like box turtles, as well as wide-ranging animals like black bears.”
By understanding the routes and areas animals actually use, through uniting computation with conservation, maps like this can help the federal government and conservation groups develop effective strategies that span states but also serve local populations. Or, as Leonard says, “The maps provide novel information that can help all these sources come up with smart and effective conservation plans.”